Listing Courtesy of: (641) 780-8804 - Dianna Elder - Realty ONE Group Impact 641-780-8804
For Sale

150 10th Avenue NE Altoona, IA 50009

Down payment assistance icon
Single Family Residence
4 Beds
3 Baths
1,809 Sq. Ft.
0.29 Acre Lot

Property Activity

Time on Site
101 days
Days on Market
Views
27
Saves
0
Last updated on 2/21/2025 6:57 AM
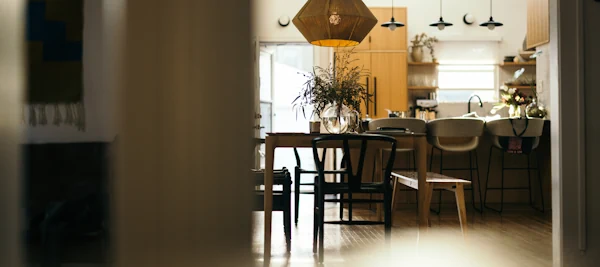
Welcome to the coveted Cedar II plan from Jerry’s Homes Century Collection! This sought-after 4-bedroom home offers an inviting open-concept design that seamlessly connects the living, dining, and kitchen areas. The kitchen features a generous peninsula that opens into a spacious living area, comple...te with a cozy gas fireplace. This home also has upgraded 9 ft ceilings on the main level! On the first floor, you’ll find stainless steel appliances and a convenient half bathroom. Upstairs, enjoy the convenience of a laundry room, a full bath, and four bedrooms, including the expansive primary suite with a roomy walk-in closet and an en-suite featuring a double vanity and shower. The daylight basement is prepped for a future bathroom, ready for your personal touch. Jerry’s Homes has been proudly building homes since 1957. *Floor Plan photos may include upgrades & Photos are Similar To Continue reading
MLS#
707802
Property Type
Single Family
Bedrooms
4
Bathrooms
1 Full/1 Three-Qtr/1 Half
Year Built
2024
HOA Fee
$200 Annually
Square Feet
1,809 sq. ft
Lot Size
0.29
Stories
2.0

Receive an email as soon as the price changes

Receive an email

as soon as the price changes
Get Price Alerts

Tax History for 150 10th Ave NE

Expand/collapse icon
Year Property Taxes Change Tax Assessment Change
2024$6
-
-$500
-
-
2023-
$500
No records available.
Location error icon Sorry, no content was found for this location.
Data sourced from public records, where available.

Powered by Xome®

Rental Valuation Estimate for 150 10th Ave NE

Expand/collapse icon
Low Range
High Range
Rental Value i map pin
icon of rental price
Average Rental Price
i
Average Rental Price: The average estimated monthly rental price, calculated based on similar properties. (It doesn't consider a property's specific condition or renovations.)
Per Month
icon of trends
Average Rental Trend
i
Average Rental Trend: The change of the estimated average monthly rental price over the past 12 months, calculated based on similar properties. (It doesn't consider a property's specific condition or renovations.)
Last 12 months
icon of vacancy
Vacancy Rate
i
Vacancy Rate: The vacancy percentage, based on the number of available rental properties in the area over the past 12 months, calculated based on similar properties. (It doesn't consider a property's specific condition or renovations.)
Location error icon Sorry, no content was found for this location.

Powered by Xome®

Xome ValueSM Disclosure

The Xome Value displayed in connection with a property is computer-generated by the application of various proprietary mathematical formulas and techniques using currently available local market, licensed and proprietary data. The displayed Xome Value is not prepared or provided by a licensed appraiser, does not constitute an appraisal of the subject property, and should not be relied upon as such. Data used to generate the Xome Value does not include information that could be derived from a visible inspection of the subject property and its surroundings. The condition of a property can materially affect the accuracy of a property's Xome Value. The data, and information derived from such data, in a Xome Value is provided on an "AS AVAILABLE" and "AS IS" basis and is provided for informational purposes only. Although we have attempted to provide reliable data and use reliable methodologies in providing a property's Xome Value, Xome Inc., its affiliates and their respective members, directors, officers and employees make no representations or warranties regarding the accuracy of a property's Xome Value on any specific date and expressly disclaim the obligation to update such value. All uses of the Xome Value are at the user's sole risk, and shall be for personal, non-commercial use and for no other purpose. Xome Inc., its affiliates and their respective members, directors, officers and employees are not liable for the accuracy of a property's Xome Value or any information related thereto. Your use of Xome Value must in all cases comply with all applicable laws and regulations.

Close

Comparable Home Sales for 150 10th Ave NE

Expand/collapse icon

Comparable nearby sales are a major factor used by the Xome Value® to estimate the value of a home.

Location error icon Sorry, no content was found for this location. There are no nearby comparable home sales.
# Address List Price List Date Sold Price Sold Date Beds Baths Sqft Price/Sqft Mobile Summary Mobile Price
Orange marker
# Address List Price List Date Sold Price Sold Date Beds Baths Sqft Price/Sqft Mobile Summary Mobile Price
Empty Column Median Label List Price List Date Sold Price Sold Date Beds Baths Sqft Price/Sqft Mobile Summary Mobile Price
View More
The Comparable Home Sales chart is produced by analyzing a data set that contains the last 5 years of property sales within 3 miles of the subject property. Each property in this data set is analyzed on multiple factors such as square footage, bedrooms, bathrooms, lot size and more to arrive at a 'Relevance Score.' Comparable properties are then ordered from most similar to least similar for comparison purposes.

Powered by Xome®

Enter your work address to view actual drive times with traffic for this property.


Calculating ...
Here is the weekday INRIX Drive Time from this property to . Change Address

Nearby Schools for 150 10th Ave NE

Expand/collapse icon

Public Schools

Rating School Name Grades Distance
No records found.

Private Schools

Rating School Name Grades Distance
No records found.
Location error icon Sorry, no content was found for this location.

Walk Score measures the walkability of any address, Transit Score measures access to public transit on a scale of 1-100.

Source: Walk Score®

Area Statistics

Expand/collapse icon

People

Zip City County National
Population 19,190 19,345 488,871 329.73M
Population Density 762 1,788 854 93
People per Household 2.7 2.7 2.5 2.6
Median Age 37.0 36.2 35.9 38.4
Median Household Income $84,204 $83,514 $73,015 $69,021
Average Income $36,970 $36,264 $38,475 $37,638

Economy

Zip City County National
Unemployment 2.20 % 2.20 % 2.20 % 3.20 %
Recent Job Growth 1.56 % 1.56 % 1.56 % 1.40 %
Future Job Growth 47.30 % 47.30 % 47.30 % 42.20 %
Sales Tax 7.00 % 7.00 % 7.00 % 7.02 %
Income Tax 7.44 % 7.44 % 7.44 % 22.00 %
Cost of Living Index 100 99 94 100

Environment

Zip City County National
Altitude 917 955 903 2443
Rainfall (inches annually) 36.0 36.0 35.9 38.1
Snowfall (inches annually) 33.7 33.7 33.0 27.8
January Avg. Low Temp 12.2 12.2 12.2 21.7
July Avg. High Temp 85.5 85.5 85.6 85.8
Days of Precipitation Annually 108 108 108 106
Days Mostly Sunny Annually 202 201 202 205
Comfort Index (during hot weather) 6 6 6 7
Location error icon Sorry, no content was found for this location.
Source: Sperling's Best Places

Median Sales Price/Sq.Ft. in 50009

Expand/collapse icon

Median Sales Price Per Square Foot provides a quick, high-level way to evaluate appreciation or depreciation of property values over time in the selected area. Using the price per square foot can help you estimate a properties' market value.

No data for current time range.
Try selecting another range option.
Location error icon Sorry, no content was found for this location.
The median price represents a midpoint for property values in the market — half of the properties sold for a higher price and half sold for lower. The median value (as opposed to average) is used so that extreme sales prices, both high and low, don't skew the interpretation of where property values in a market are heading.

Powered by Xome®

Months of Supply in 50009

Expand/collapse icon

This chart shows how many months it would take to sell the available inventory in the specified market. A higher Months of Supply generally indicates a buyer's market while a lower Months of Supply generally indicates a seller's market.

Show: For Sale and Sold
Months of Supply
For Sale
Sold
No data for current time range.
Try selecting another range option.
Location error icon Sorry, no content was found for this location.
Source: Xome Licensing (Xome CT LLC via, in part, its MLS licenses). Data through 2/1/2025.

How much home can I afford?

Get prequalified today and learn more.

Get Started

Rental Valuation Estimate

rental value icon
Per Month
See More Trends

Nearby Homes For Sale

Listing Courtesy of: (641) 780-8804 - Dianna Elder - Realty ONE Group Impact 641-780-8804
Albert Wright Page, License B62241000, Xome Inc., License FO5635000, AlbertW.Page@xome.com, 844-400-XOME (9663), 4471 North Billman Estates, Shelbyville, IN 46176

MLS logo

This information is provided exclusively for consumers’ personal, non-commercial use, and may not be used for any purpose other than to identify prospective properties consumers may be interested in purchasing. This is deemed reliable but is not guaranteed accurate by the MLS. Copyright 2025 Des Moines Area Association of Realtors. All rights reserved.
This content last refreshed on 2/21/2025 6:57 AM. Some properties which appear for sale on this web site may subsequently have sold or may no longer be available.
Information is deemed reliable but is not guaranteed.
Prequalify
BESbswy