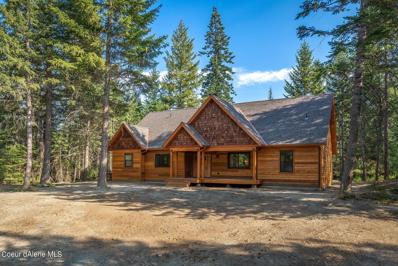
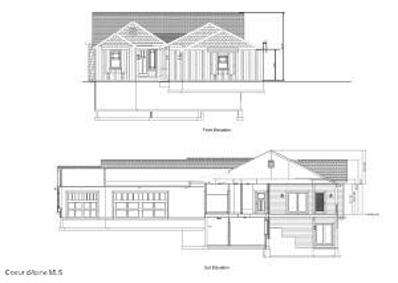
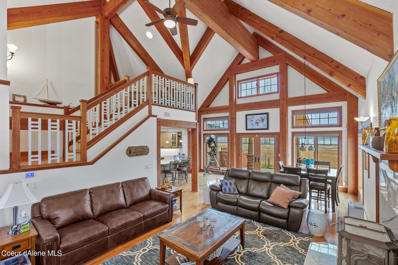
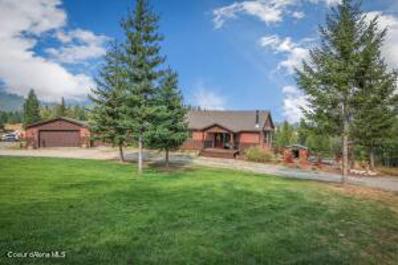
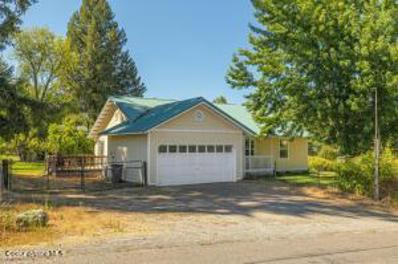
103 Pumphouse Ln Sagle, ID 83860
Property Activity
Receive an email as soon as the price changes
Receive an email
as soon as the price changesTax History for 103 Pumphouse Ln
| Year | Property Taxes | Tax Assessment | ||
|---|---|---|---|---|
| 2024 | $7,928 +52.46% | $1,769,248 +31.79% | ||
| 2023 | $5,200 -25.16% | $1,342,519 -9.62% | ||
| 2022 | $6,948 -1.96% | $1,485,485 +39.44% | ||
| 2021 | $7,087 +9.81% | $1,065,290 +21.15% | ||
| 2020 | $6,454 - | $879,338 +6.6% | ||
| 2019 | $6,454 +2.62% | $824,930 +14.45% | ||
| 2018 | $6,289 +19.4% | $720,762 +9.23% | ||
| 2017 | $5,267 | $659,876 | ||
| No records available. | ||||
Powered by Xome®
Rental Valuation Estimate for 103 Pumphouse Ln
Powered by Xome®
Xome ValueSM Disclosure
The Xome Value displayed in connection with a property is computer-generated by the application of various proprietary mathematical formulas and techniques using currently available local market, licensed and proprietary data. The displayed Xome Value is not prepared or provided by a licensed appraiser, does not constitute an appraisal of the subject property, and should not be relied upon as such. Data used to generate the Xome Value does not include information that could be derived from a visible inspection of the subject property and its surroundings. The condition of a property can materially affect the accuracy of a property's Xome Value. The data, and information derived from such data, in a Xome Value is provided on an "AS AVAILABLE" and "AS IS" basis and is provided for informational purposes only. Although we have attempted to provide reliable data and use reliable methodologies in providing a property's Xome Value, Xome Inc., its affiliates and their respective members, directors, officers and employees make no representations or warranties regarding the accuracy of a property's Xome Value on any specific date and expressly disclaim the obligation to update such value. All uses of the Xome Value are at the user's sole risk, and shall be for personal, non-commercial use and for no other purpose. Xome Inc., its affiliates and their respective members, directors, officers and employees are not liable for the accuracy of a property's Xome Value or any information related thereto. Your use of Xome Value must in all cases comply with all applicable laws and regulations.
Enter your work address to view actual drive times with traffic for this property.
Walk Score measures the walkability of any address, Transit Score measures access to public transit on a scale of 1-100.
Area Statistics
People
| Zip | City | County | National | |
| Population | 6,141 | 6,141 | 46,481 | 329.73M |
| Population Density | 51 | 51 | 26 | 93 |
| People per Household | 2.8 | 2.8 | 2.5 | 2.6 |
| Median Age | 50.9 | 50.9 | 48.2 | 38.4 |
| Median Household Income | $67,981 | $67,981 | $55,206 | $69,021 |
| Average Income | $37,072 | $37,072 | $31,671 | $37,638 |
Economy
| Zip | City | County | National | |
| Unemployment | 4.20 % | 4.20 % | 4.20 % | 3.20 % |
| Recent Job Growth | -2.42 % | -2.42 % | -2.42 % | 1.40 % |
| Future Job Growth | 33.42 % | 33.42 % | 33.42 % | 42.20 % |
| Sales Tax | 6.00 % | 6.00 % | 6.00 % | 7.02 % |
| Income Tax | 6.00 % | 6.00 % | 6.00 % | 22.00 % |
| Cost of Living Index | 117 | 117 | 108 | 100 |
Environment
| Zip | City | County | National | |
| Altitude | 2198 | 2198 | 3173 | 2443 |
| Rainfall (inches annually) | 30.2 | 30.2 | 29.8 | 38.1 |
| Snowfall (inches annually) | 60.7 | 60.7 | 63.0 | 27.8 |
| January Avg. Low Temp | 22.1 | 22.1 | 21.1 | 21.7 |
| July Avg. High Temp | 81.5 | 81.5 | 81.8 | 85.8 |
| Days of Precipitation Annually | 131 | 131 | 130 | 106 |
| Days Mostly Sunny Annually | 174 | 174 | 174 | 205 |
| Comfort Index (during hot weather) | 6 | 6 | 6 | 7 |
Months of Supply in 83860
This chart shows how many months it would take to sell the available inventory in the specified market. A higher Months of Supply generally indicates a buyer's market while a lower Months of Supply generally indicates a seller's market.
Try selecting another range option.
How much home can I afford?
Get prequalified today and learn more.