
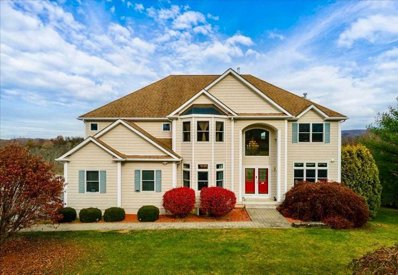
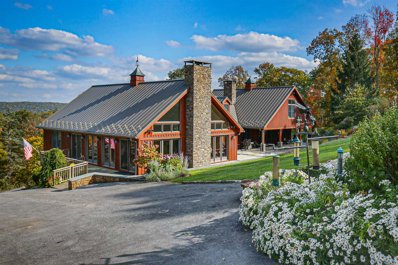
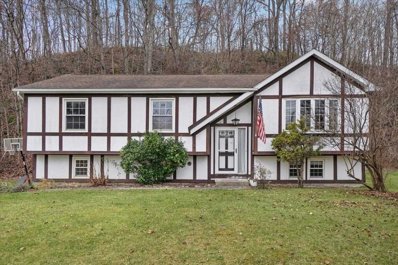
Comparable Home Sales for 8 Salisbury Rd
Comparable nearby sales are a major factor used by the Xome Value® to estimate the value of a home.
| # | Address | List Price | List Date | Sold Price | Sold Date | Beds | Baths | Sqft | Price/Sqft | Mobile Summary | Mobile Price |
|---|---|---|---|---|---|---|---|---|---|---|---|
| |
| # | Address | List Price | List Date | Sold Price | Sold Date | Beds | Baths | Sqft | Price/Sqft | Mobile Summary | Mobile Price |
|---|
| Empty Column | Median Label | List Price | List Date | Sold Price | Sold Date | Beds | Baths | Sqft | Price/Sqft | Mobile Summary | Mobile Price |
|---|
Powered by Xome®
Median Sales Price/Sq.Ft. in 12563
Median Sales Price Per Square Foot provides a quick, high-level way to evaluate appreciation or depreciation of property values over time in the selected area. Using the price per square foot can help you estimate a properties' market value.
Try selecting another range option.
Powered by Xome®
Months of Supply in 12563
This chart shows how many months it would take to sell the available inventory in the specified market. A higher Months of Supply generally indicates a buyer's market while a lower Months of Supply generally indicates a seller's market.
Try selecting another range option.
Real Estate Trends in Patterson, NY
Homes Sold
last 90 days
Price
last 90 days
Per Sq. Foot
last 90 days


Nearby Schools for 8 Salisbury Rd
Public Schools
| Rating | School Name | Grades | Distance |
|---|---|---|---|
| Brewster High School | 9-12 | 3.29 mi | |
| John F Kennedy Elementary School | K-2 | 3.43 mi | |
| Henry H Wells Middle School | 6-8 | 3.64 mi | |
| No records found. | |||
Private Schools
| Rating | School Name | Grades | Distance |
|---|---|---|---|
| No records found. | |||
Area Statistics
People
| Zip | City | County | National | |
| Population | 7,985 | 11,574 | 97,960 | 329.73M |
| Population Density | 349 | 359 | 425 | 93 |
| People per Household | 2.7 | 2.8 | 2.8 | 2.6 |
| Median Age | 41.3 | 41.6 | 44.2 | 38.4 |
| Median Household Income | $95,000 | $102,092 | $111,617 | $69,021 |
| Average Income | $34,584 | $40,750 | $49,808 | $37,638 |
Economy
| Zip | City | County | National | |
| Unemployment | 2.20 % | 2.20 % | 2.20 % | 3.20 % |
| Recent Job Growth | 0.33 % | 0.33 % | 0.33 % | 1.40 % |
| Future Job Growth | 36.76 % | 36.76 % | 36.76 % | 42.20 % |
| Sales Tax | 8.38 % | 8.38 % | 8.38 % | 7.02 % |
| Income Tax | 5.85 % | 5.85 % | 5.85 % | 22.00 % |
| Cost of Living Index | 135 | 132 | 147 | 100 |
Environment
| Zip | City | County | National | |
| Altitude | 486 | 443 | 642 | 2443 |
| Rainfall (inches annually) | 51.0 | 50.9 | 50.4 | 38.1 |
| Snowfall (inches annually) | 48.5 | 46.8 | 42.2 | 27.8 |
| January Avg. Low Temp | 17.5 | 17.5 | 17.9 | 21.7 |
| July Avg. High Temp | 82.3 | 82.1 | 82.4 | 85.8 |
| Days of Precipitation Annually | 128 | 126 | 122 | 106 |
| Days Mostly Sunny Annually | 198 | 198 | 200 | 205 |
| Comfort Index (during hot weather) | 6 | 6 | 7 | 7 |